Shorten
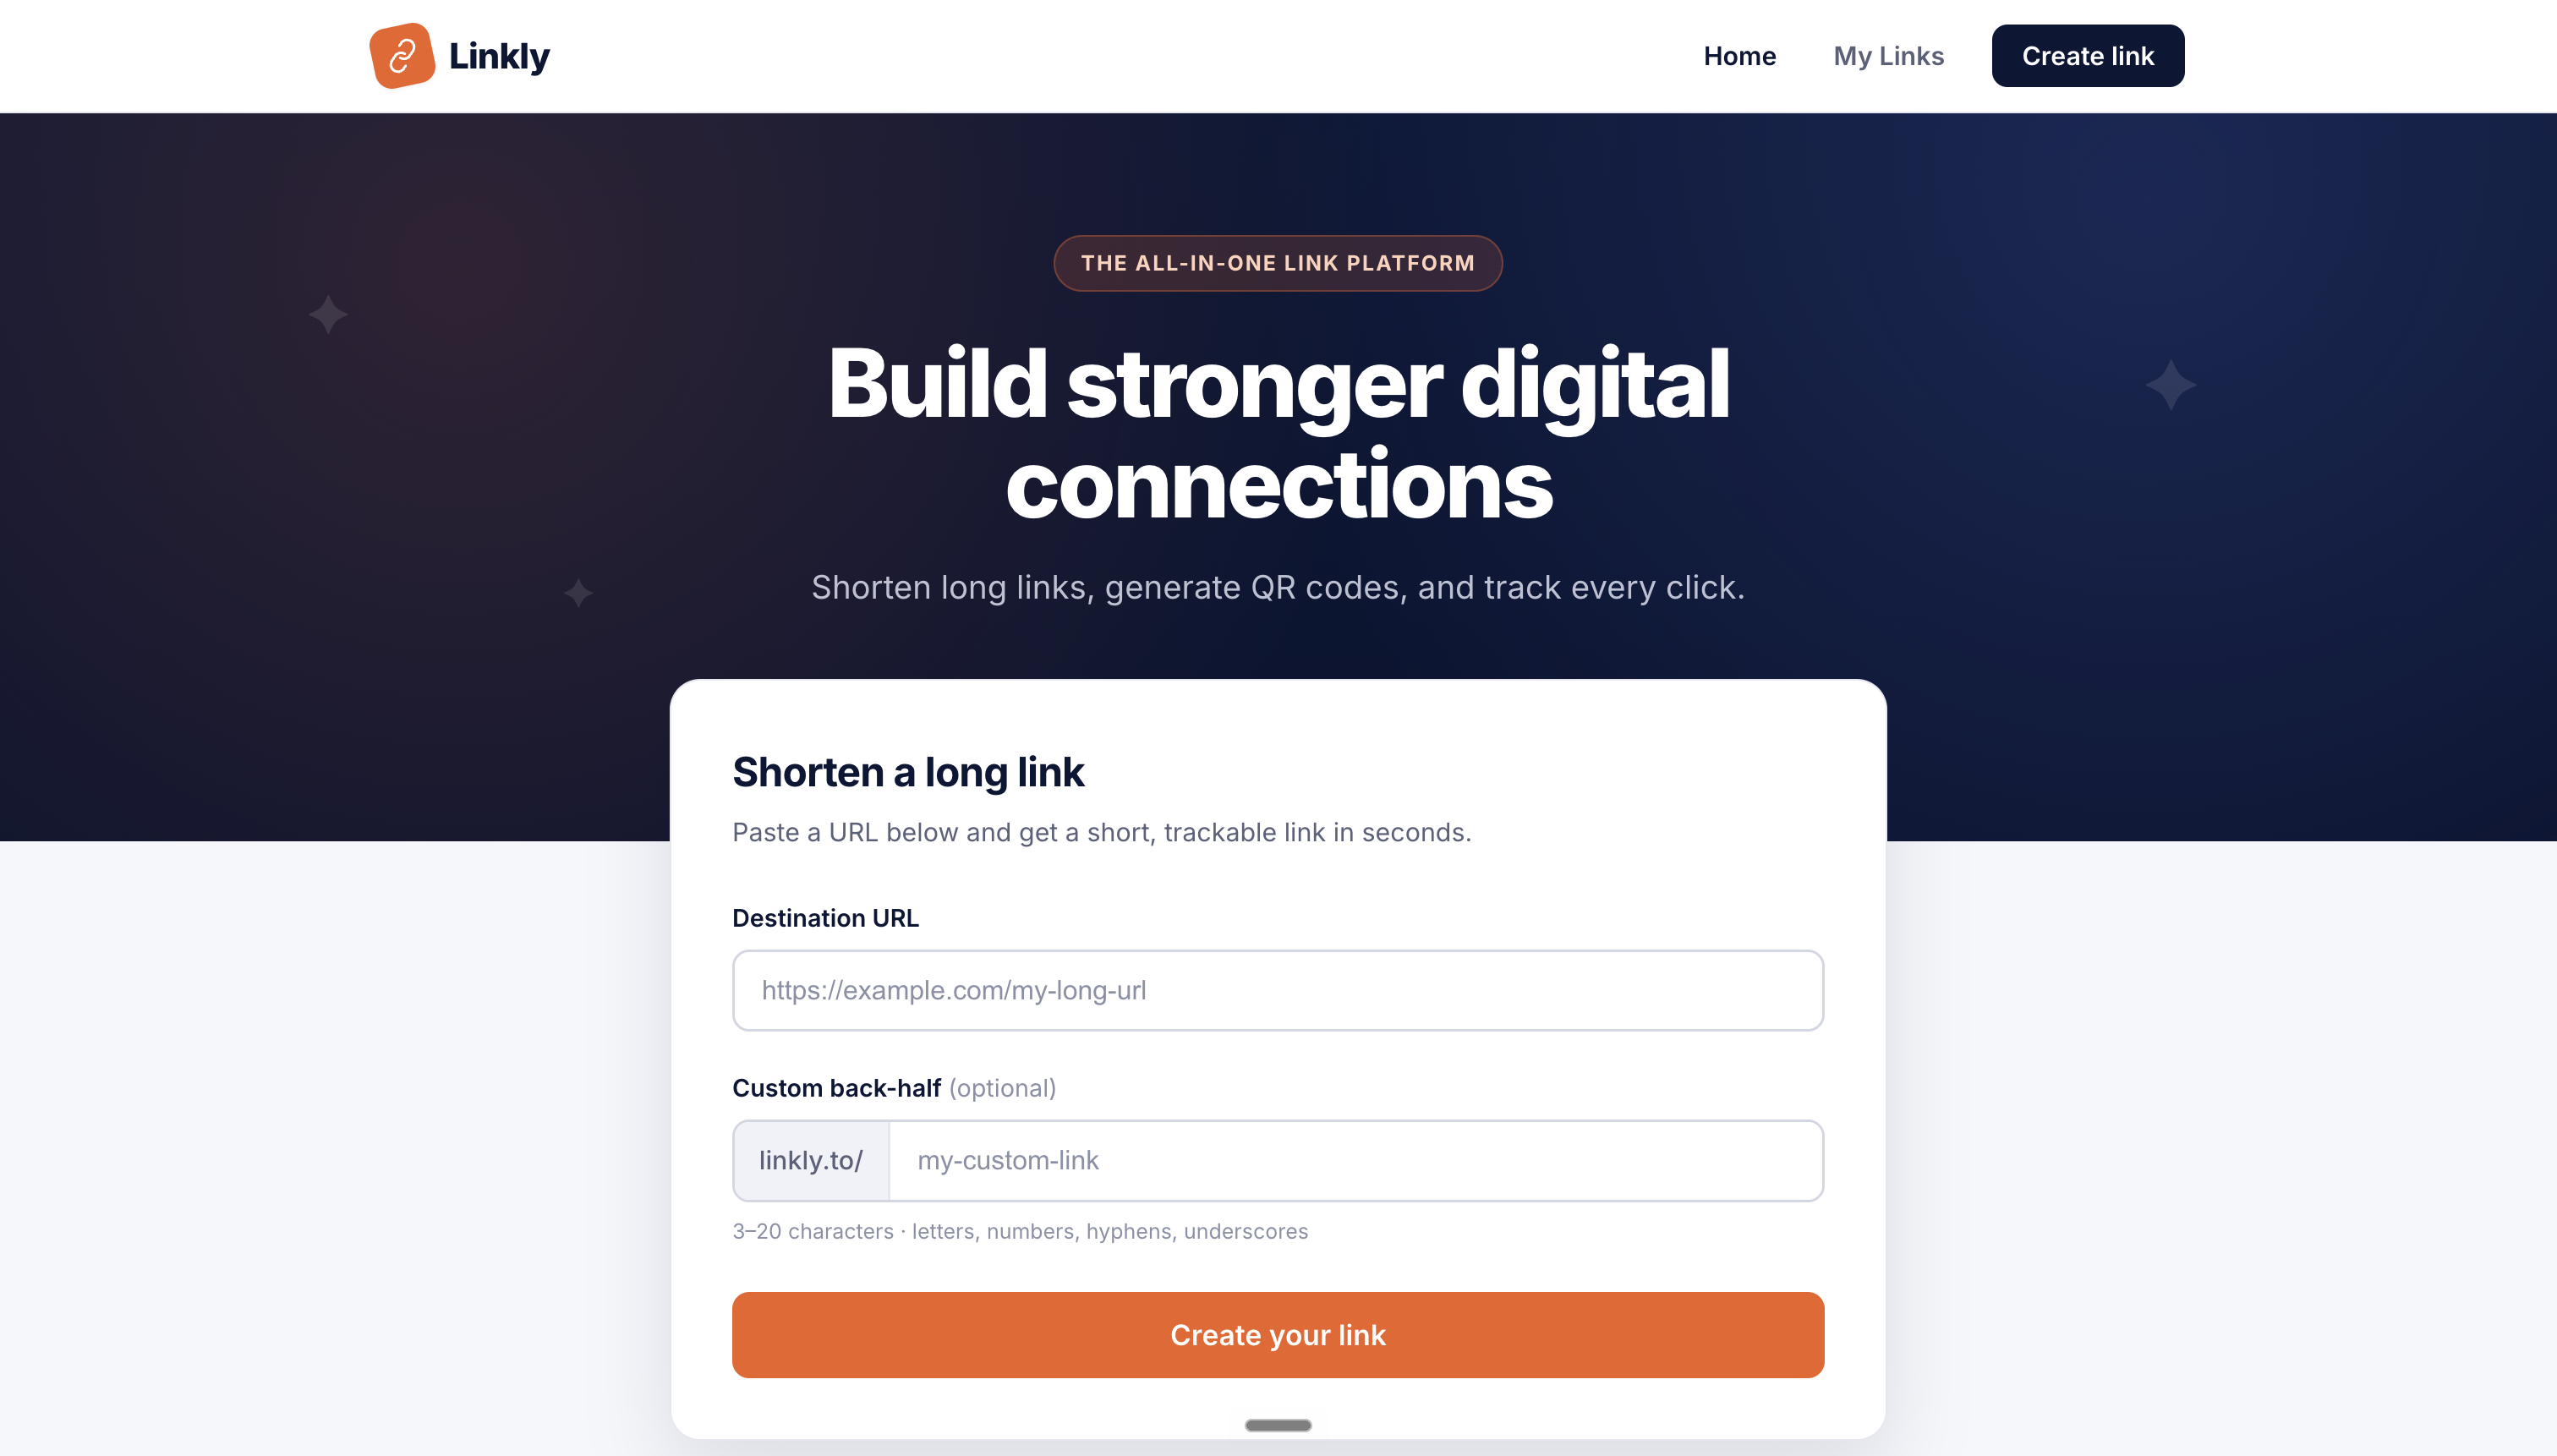
The React client creates generated or custom aliases and returns shareable links with QR assets.
Analytics product · Data visualization / 2026
Turning a tiny redirect into useful, legible product intelligence.
01 / The problem
Every visit must redirect immediately while still recording useful context, and the resulting event stream must be transformed into analytics that remain readable across sparse and uneven data.
02 / System flow
The React client creates generated or custom aliases and returns shareable links with QR assets.
Express resolves each key, records request context, then issues the destination redirect.
PostgreSQL and Prisma retain links and click events for country, device, browser, and referrer rollups.
Recharts turns daily series and ranked dimensions into an approachable reporting view.
03 / Decisions that shaped the build
Raw redirect events are retained so new aggregations can be derived without changing the short-link creation model.
Daily buckets use UTC keys and fill empty dates, keeping sparse activity aligned and visually honest.
Each result includes QR endpoints in PNG, JPEG, and SVG formats for digital or offline sharing.
04 / Reliability
05 / Reflection
“Linkly made a useful distinction between collecting data and explaining it: the redirect path should stay small, while the analytics layer does the patient work of adding context.”Explore selected work